Update 19 – August 15, 2021
Yi Wang, Assistant Professor & Extension Potato and Vegetable Production Specialist, UW- Madison, Dept. of Horticulture, 608-265-4781, Email: wang52@wisc.edu.
This week I am showing some aerial images that were taken from our fertigation trial. The objective of the trial was to evaluate effects of nitrogen credits in groundwater on growth of two potato varieties Snowden and Colomba. We have four treatments in this trial. Treatment A is a control. Treatment B and C had the same total seasonal N rate, with B having N applied up until tuber initiation, and C having N split between tuber initiation (small amount), and four fertigation events. Treatment D is an over-application rate. Below are the N application schemes of the four N rates.
Fertigation trial setup:
| Treatment ID | Planting (6-30-22- 4S) | Emergence (21-0-0-24S Ammonium Sulfate) | Tuber Initiation (34-0-0 Ammonium Sulfate) | Fertigation (32-0-0 UAN) | Seasonal Total | Notes | |||
| 4/23 | 5/12 | 6/4 | 6/30 | 7/10 | 7/20 | 7/30 | |||
| A | 40 | – | – | – | – | – | – | 40 | Control |
| B | 40 | 70 | 150 | – | – | – | – | 260 | No fertigation |
| C | 40 | 70 | 30 | 30 | 30 | 30 | 30 | 260 | With fertigation |
| D | 40 | 70 | 120 | 30 | 30 | 30 | 30 | 350 | Over- application |
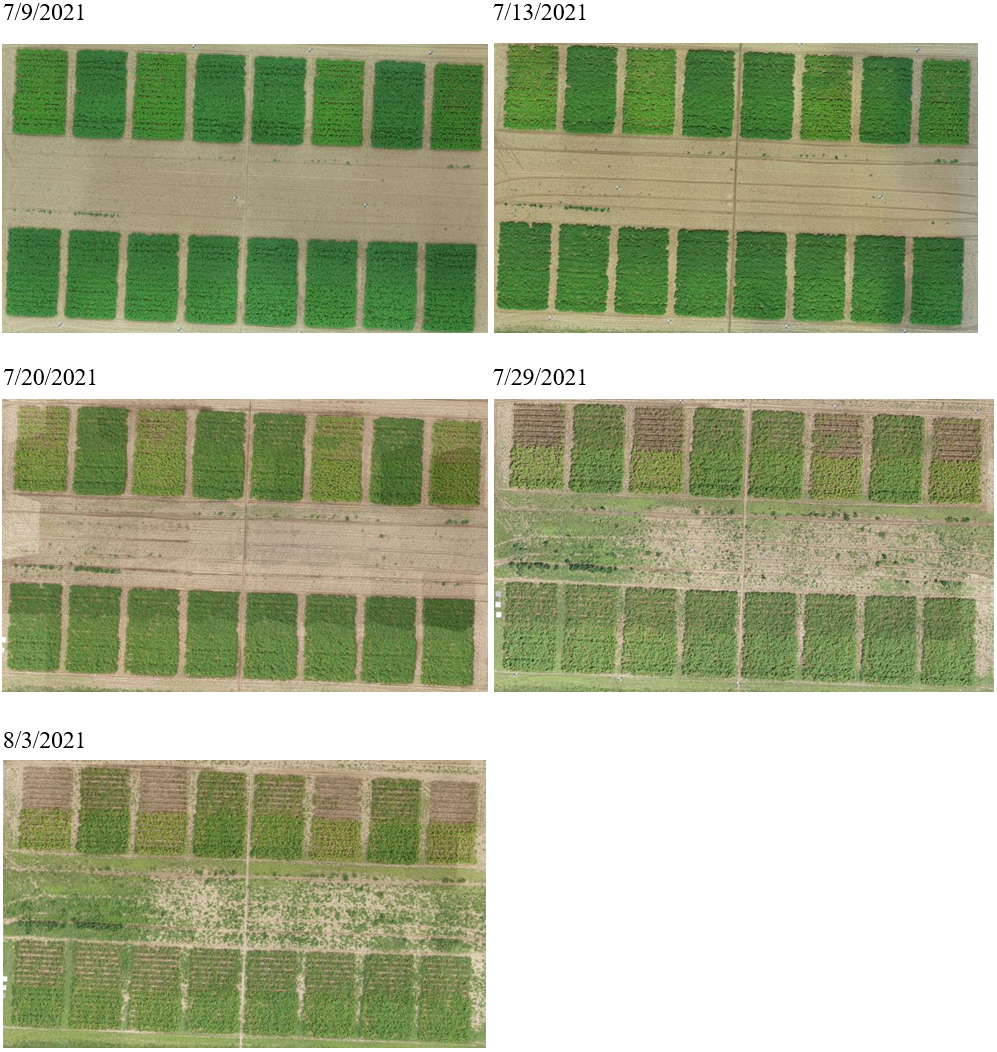
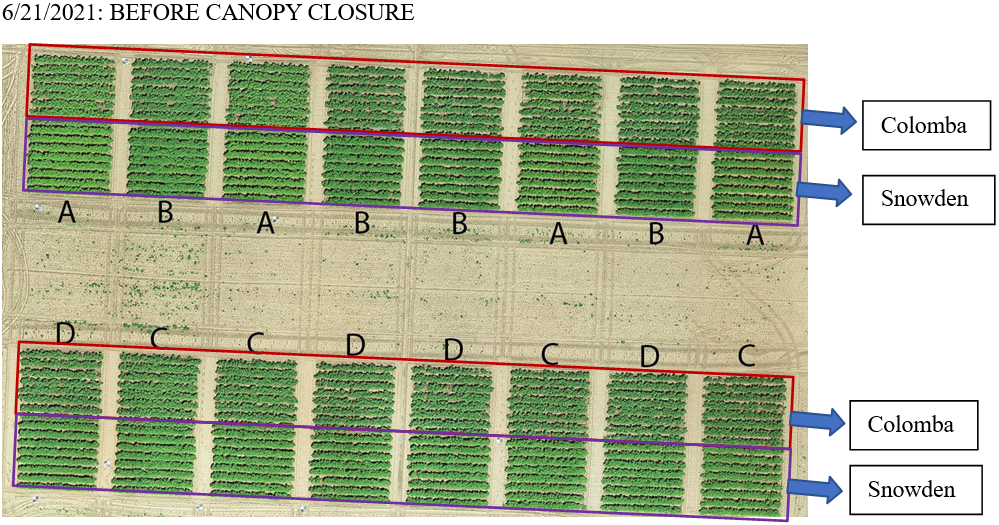 From the images taken on July 13th, plots under the control treatment started to be clearly yellow, whereas plots under the other three treatments had darker green colors. Colomba plants under the control treatment started to senesce on July 20th, and we can see that Colomba were almost 100% senescent on July 29th. Snowden progressed at a slower pace compared to Colomba, under each N rate. It is also noticed that Snowden plants under the control started to go down on August 3rd, while plants under other three treatments were still vigorous and healthy. From the aerial images, we cannot simply eyeball difference between treatment B, which had a large amount of N applied at tuber initiation, and no fertigation; treatment C that had a small N application at tuber initiation, but received four fertigation events during tuber bulking; and treatment D, which is a combination of treatments B and C. We are testing the groundwater nitrate-N level in the field and will be able to calculate how many N credits we get from irrigation water. We are also testing petiole nitrate-N for all treatments during the period that we collected aerial images.
Amanda Gevens, Chair, Professor & Extension Vegetable Pathologist, UW–Madison, Dept. of Plant Pathology, 608-575-3029, Email: gevens@wisc.edu.
Potato Disease Modelling and Management of Early Blight and Late Blight: Current P-Day (Early Blight) and Disease Severity Value (Late Blight) Accumulations. Many thanks to Ben Bradford, UW–Madison Entomology; Stephen Jordan, UW–Madison Plant Pathology; and our grower collaborator weather station hosts for supporting this disease management effort. A Potato Physiological Day or P-Day value of ≥300 indicates the threshold for early blight risk and triggers preventative fungicide application. A Disease Severity Value or DSV of ≥18 indicates the threshold for late blight risk and triggers preventative fungicide application. Red text in table indicates threshold has been met or surpassed. Weather data used in these calculations comes from weather stations that are placed in potato fields in each of the four locations (substitute data from https://agweather.cals.wisc.edu/vdifn as needed). Data are available in graphical and raw formats for each weather station at: https://vegpath.plantpath.wisc.edu/dsv/
Late blight (DSV) and Early blight (P-days) risk scores for Aug 15, 2021:
| Location | Planting Date | 50% Emergence Date | Disease Severity Values (DSVs) 8/15 | Potato Physiological Days (P-Days) 8/15 | |
|---|---|---|---|---|---|
| Grand Marsh | Early | April 2 | May 10 | 88 | 685 |
| Mid | April 10 | May 15 | 88 | 675 | |
| Late | May 1 | May 23 | 82 | 613 | |
| Hancock | Early | April 5 | May 12 | 44 | 684 |
| Mid | April 15 | May 15 | 44 | 675 | |
| Late | May 5 | May 23 | 40 | 613 | |
| Plover | Early | April 7 | May 12 | 80 | 651 |
| Mid | April 20 | May 20 | 77 | 607 | |
| Late | May 7 | May 30 | 72 | 545 | |
| Antigo | Early | April 26 | May 28 | 41 | 622 |
| Mid | May 10 | June 5 | 41 | 584 | |
| Late | May 20 | June 13 | 41 | 515 | |
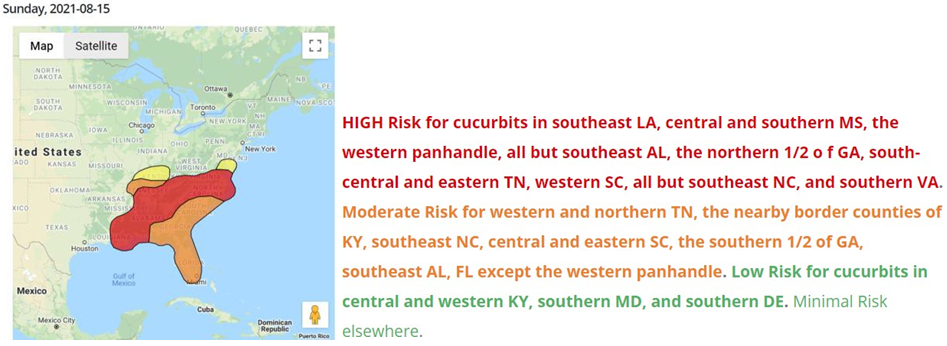 Cucurbit downy mildew risk for Aug 15, 2021
View this newsletter as a PDF