In This Issue:
- Potato and vegetable crop production status updates; pollutant, ozone, and sulfur dioxide injury on potato
- Potato and tomato early blight and late blight disease updates
- Cucurbit downy mildew updates
- Potato Virus Y updates and management
- UW Hancock ARS Potato Field Day reminder – Jul 13, 2023 1-4:30PM!
- Wisconsin Potato Coalition & Wisconsin Seed Potato Certification Program – Starks Farm Field Day – Rhinelander WI agenda
Yi Wang, Associate Professor & Extension Potato and Vegetable Production Specialist, UW–Madison, Dept. of Horticulture, 608-265-4781, Email: wang52@wisc.edu.
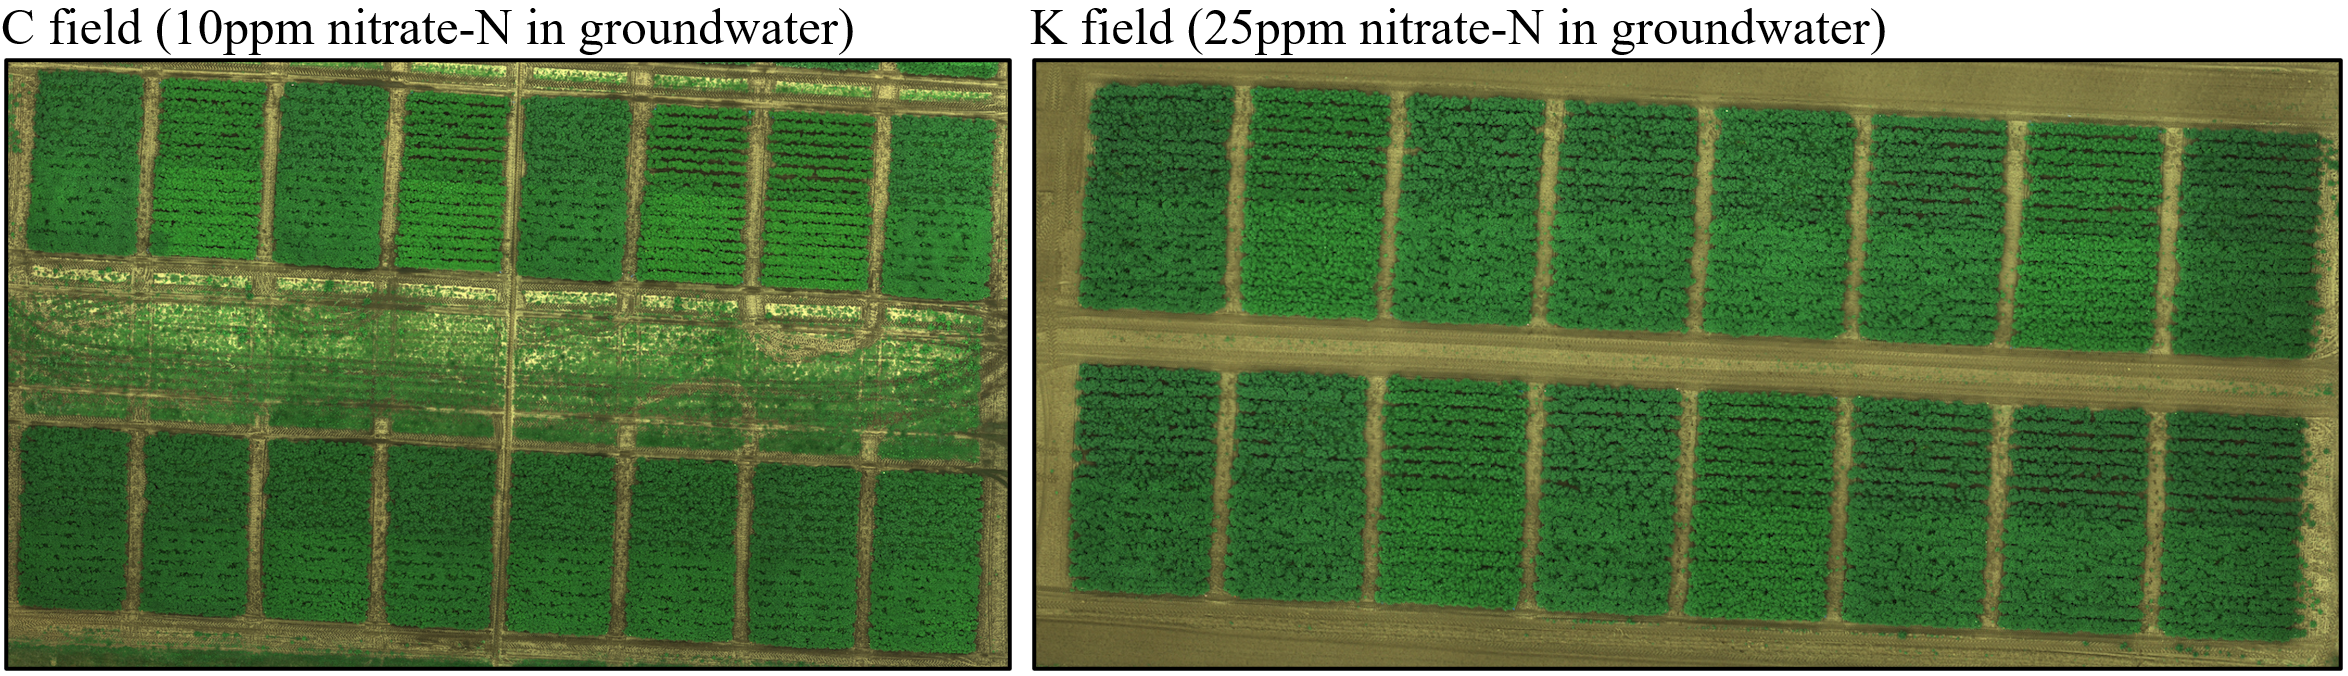
Besides the lack of rainfall, the growing season has been going well so far with irrigation. Below are some aerial images of our potato and bean trials at the UW Hancock Ag Research Station. For the potatoes, we can clearly see the canopy color difference between Goldrush (the north eight rows of each strip) and Snowden (the south eight rows of each strip) below. The potatoes in the C field showed lighter green color of the control N treatments (that only received the starter fertilizer at 45 lb/acre) compared to other higher N rates. This difference has not been noted in the K field. It is noteworthy that nitrate-N in the C field is 10 ppm, and is 25 ppm in the K field.
Potato fertigation trials:
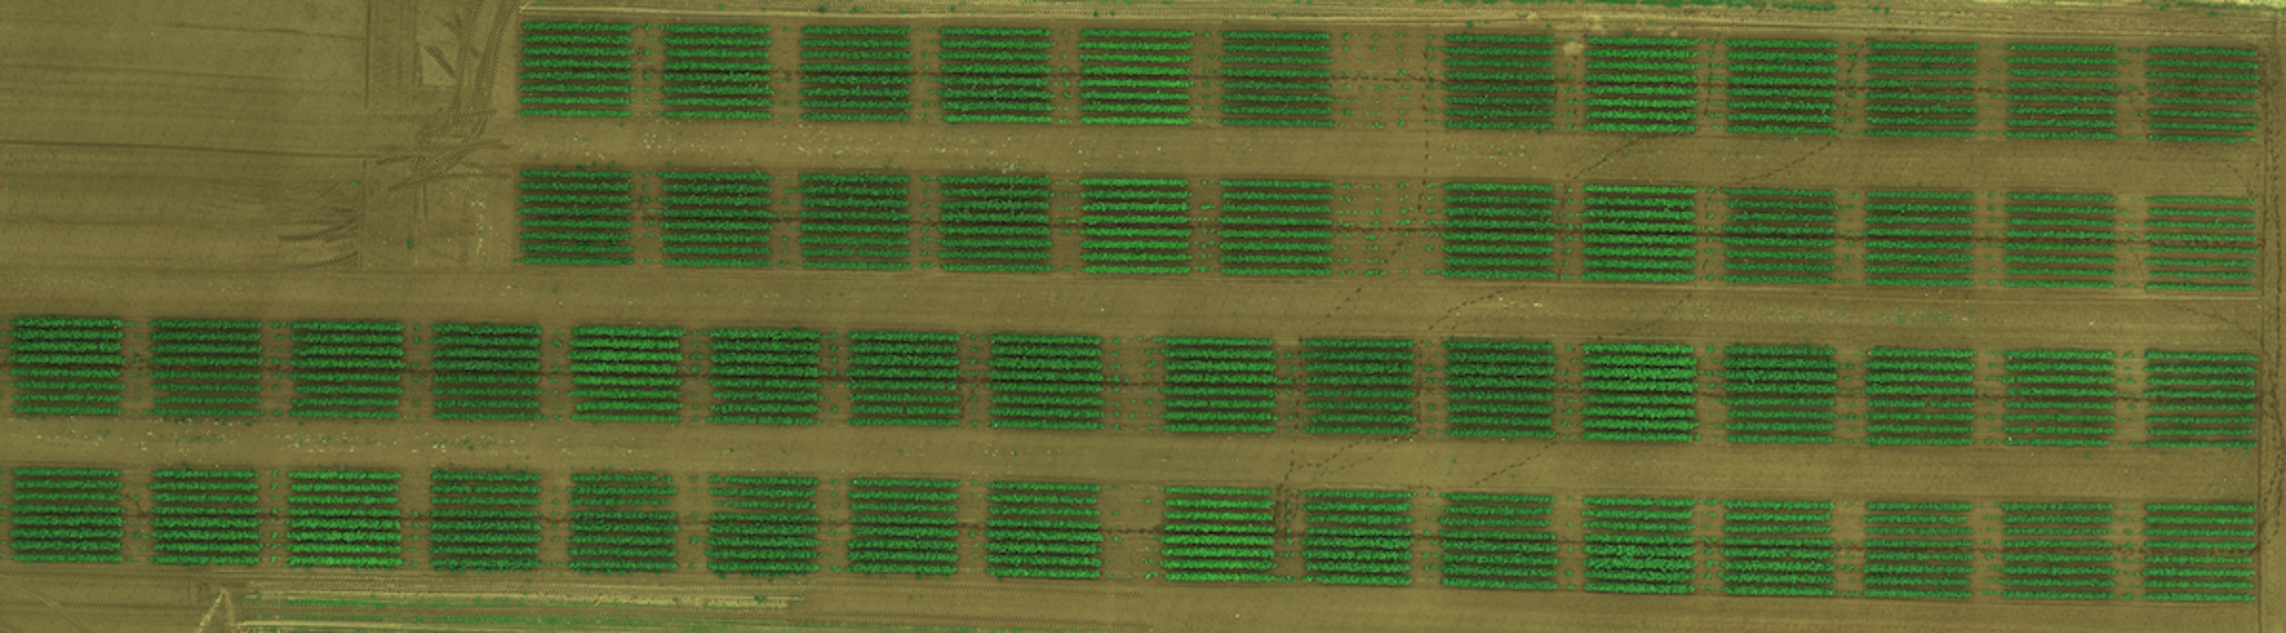
For the beans, we can easily pick up the control treatments (that only received the starter fertilizer at 25 lb N/acre) because of their lighter green color.
Some folks have reported foliar damage due to poor air quality from the wildfire this past week. Potato plants can be injured when exposed to high concentrations of various air pollutants. Black flecking or pepper-like spots could be noticed on the underside of leaves and sometimes on the top. Injury can range from visible markings on the foliage to complete kill of the plant. Growth and yield can also be impacted from exposure to air pollutants. Development and severity of injury depends on a number of factors. These include concentration of the pollutants, environmental conditions, stage of development of the plant, varietal susceptibility and overall health of the plants.
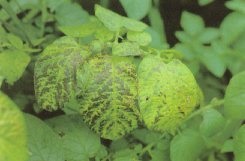
Chlorosis and interveinal necrosis on the foliage of Atlantic after exposure to air pollutants.
The following combinations of environmental conditions could contribute to a build-up of injurious levels of pollutants.
- Atmospheric ozone levels over 80 ppb for four or five consecutive hours, or 70 ppb for a day or two are usually sufficient to injure exposed foliage at a susceptible stage of growth.
- Humid conditions with cloudy, hazy overcast days and little breeze leads to a high concentration of pollutants at ground level. High pollution indexes are a good indication that this is occurring.
- Foggy conditions and heavy dews also contribute.
When atmospheric conditions for injury exist, definite symptoms on the potato foliage may not always be evident, but the crop may take on a slightly yellow tinge and mature faster than when conditions are normal.
The stage of development of the potato plant is also an important factor in its susceptibility to air pollution. The potato crop is unlikely to show damage in the vegetative stage, but is quite susceptible in the tuber bulking stage. Stress to the potato plant including lack of nutrition, insufficient soil moisture, or disease pressure could predispose the plant to injury from high levels of air pollutant. Plants subjected to stress at tuber set may mature existing tubers and stop bulking. Yield losses would depend on the potato growth stage.
Varietal susceptibility mainly to ozone is another key factor as to whether injury will occur. Some varieties are genetically more susceptible to ozone, such as Dark Red Norland, Yukon Gold, Atlantic and Shepody.
Ozone Injury. Ozone, the major component of oxidants is formed by the action of sunlight on products of fuel combustion and can be moved to nearby growing areas by wind. Symptoms vary depending on the concentration of ozone in the air and the length of exposure, as stated before. Ozone injury occurs on the most recently emerged leaves. Typical ozone injury may not be evident on leaves exposed to a mixture of pollutants. Symptoms differ.
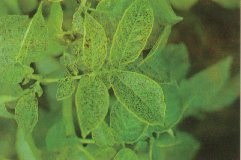
Potato foliage with flecking “pepper spotting” injury typical of ozone injury.
Potato leaves are relatively resistant to injury by sulphur dioxides. However, exposure to high levels of sulphur dioxides will result in light tan to white necrotic areas and yields may be reduced. Sources of sulphur dioxides are emissions from coal burning power plants, smelters and from the burning of petroleum. Losses in sensitive potato cultivars may be severe following exposure early in the season.
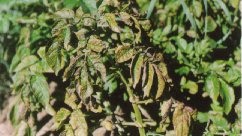
Injury from air pollution can be expressed by the plant in the form of bronzing.
Amanda Gevens, Chair, Professor & Extension Vegetable Pathologist, UW–Madison, Dept. of Plant Pathology, 608-575-3029, Email: gevens@wisc.edu, Lab Website: https://vegpath.plantpath.wisc.edu/
Early blight of potato/tomato. Accumulations of P-days (recall these are influenced by heat) ramped up this past week and on average we saw roughly 60 P-days across the state of Wisconsin. In all locations with the exception of Antigo (later plantings) and Rhinelander, all potato fields have reached/surpassed threshold and should receive (and continue to receive) preventative fungicide applications for early blight management. Hotter days generate roughly 10 P-days per day if you are looking ahead to likely accumulations and planned preventative fungicide applications.
Late blight of potato/tomato. Accumulations of Blitecast DSVs have been low to non-existent. Since emergence, potatoes in Wisconsin have seen between 1-5 DSVs indicating conditions generally unfavorable for the development of late blight. Overall, the weather has been very dry, with temperatures a bit too hot to promote the pathogen. The usablight.org website (
https://usablight.org/map/) indicates no reports of late blight in potato or tomato from across the US in 2023. This website continues to provide a very useful mechanism for tracking this potentially destructive crop disease, but it’s not comprehensive. Fungicides for management of late blight in tomato and potato crops are provided:
https://learningstore.extension.wisc.edu/products/commercial-vegetable-production-in-wisconsin
Current P-Day (Early Blight) and Disease Severity Value (Late Blight) Accumulations. Many thanks to Ben Bradford, UW–Madison Entomology; Stephen Jordan, UW–Madison Plant Pathology; and our grower collaborator weather station hosts for supporting this disease management effort again in 2023. A Potato Physiological Day or P-Day value of ≥300 indicates the threshold for early blight risk and triggers preventative fungicide application. A Disease Severity Value or DSV of ≥18 indicates the threshold for late blight risk and triggers preventative fungicide application. Red text in table indicates threshold has been met or surpassed. TBD indicates that data are To Be Determined as time progresses. Weather data used in these calculations is from weather stations that are placed in potato fields in each of the four locations, as available. Data from an alternative modeling source:
https://agweather.cals.wisc.edu/vdifn will be used to supplement as needed for missing data points and for additional locations (indicated with *). Data are available in graphical and raw formats for multiple locations at:
https://vegpath.plantpath.wisc.edu/dsv/.
|
|
Planting Date |
50% Emergence Date |
Disease Severity Values (DSVs) through 7/8/2023 |
Potato Physiological Days (P-Days) through 7/8/2023 |
| Spring Green* |
Early |
Apr 3 |
May 9 |
1 |
456 |
| Mid |
Apr 17 |
May 12 |
1 |
434 |
| Late |
May 10 |
May 23 |
1 |
365 |
| Arlington* |
Early |
Apr 5 |
May 10 |
2 |
456 |
| Mid |
Apr 20 |
May 15 |
2 |
418 |
| Late |
May12 |
May 25 |
2 |
358 |
| Grand Marsh |
Early |
Apr 5 |
May 10 |
2 |
427 |
| Mid |
Apr 20 |
May 15 |
2 |
394 |
| Late |
May 12 |
May 25 |
2 |
341 |
| Hancock |
Early |
Apr 10 |
May 17 |
5 |
392 |
| Mid |
Apr 22 |
May 19 |
5 |
386 |
| Late |
May 14 |
May 28 |
5 |
337 |
| Plover |
Early |
Apr 14 |
May 19 |
5 |
382 |
| Mid |
Apr 24 |
May 20 |
5 |
380 |
| Late |
May 19 |
May 29 |
5 |
330 |
| Antigo |
Early |
May 1 |
May 28 |
3 |
316 |
| Mid |
May 15 |
June 3 |
3 |
271 |
| Late |
June 7 |
June 23 |
3 |
136 |
| Rhinelander* |
Early |
May 7 |
June 1 |
2 |
284 |
| Mid |
May 18 |
June 5 |
2 |
249 |
| Late |
June 9 |
June 24 |
2 |
126 |
In addition to the potato field weather stations, we have the UW Vegetable Disease and Insect Forecasting Network tool to explore P-Days and DSVs across the state (
https://agweather.cals.wisc.edu/vdifn). This tool utilizes NOAA weather data (stations are not situated within potato fields). In using this tool, be sure to enter your model selections and parameters, then hit the blue submit button at the bottom of the parameter boxes. Once thresholds are met for risk of early blight and/or late blight, fungicides are recommended for optimum disease control. Fungicide details can be found in the 2023 Commercial Vegetable Production in Wisconsin Guide, Extension Document A3422, linked here:
https://learningstore.extension.wisc.edu/products/commercial-vegetable-production-in-wisconsin
Cucurbit Downy Mildew. The Cucurbit Downy Mildew forecasting webpage (https://cdm.ipmpipe.org/) is not forecasting the movement of the pathogen, but the group is offering reporting of findings of cucurbit downy mildew from the US. In mid-June, Dr. Mary Hausbeck reported the interception of cucurbit downy mildew spores in an air/spore trap in four Michigan counties over the past month: Allegan (SW MI), Bay, Monroe, and Saginaw. Through molecular biological testing, Dr. Hausbeck and her laboratory at Michigan State University characterized the pathogen as the Clade 2 type of the cucurbit downy mildew pathogen which tells us that this type is likely to infect cucumber and melon crops. In past years, when SW MI had cucurbit downy mildew in production fields, WI did see some movement of the disease into southeastern WI. For this reason, I am being vigilant in tracking reports of the disease in southern Michigan.
To date, there have been no reports of the disease developing in cucumber fields in MI. If reports arise, we should be considering preventative treatment of cucumber and melon crops here in southeastern Wisconsin.
Again, to date, no symptoms of cucurbit downy mildew have been reported here in Wisconsin. The disease has been confirmed on cucumber in Ontario Canada, NC and NJ; butternut squash and cucumber in SC; and watermelon, acorn/yellow summer squash, and cucumber in Georgia. These data suggest that there are both strain types of the pathogen active along the east coast. We should be watchful of all cucurbit crops. In past recent years, we have predominantly seen the cucumber strain types impacting cucurbits in Wisconsin.
Vegetable Insect Update – Russell L. Groves, Professor and Department Chair, UW–Madison, Department of Entomology, 608-262-3229 (office), (608) 698-2434 (cell), e-mail rgroves@wisc.edu. Vegetable Entomology Webpage: https://vegento.russell.wisc.edu/.
Potato virus Y (PVY) – (
https://vegento.russell.wisc.edu/pests/plant-pathogens/). A follow-up from our July 2 posting on PVY risk and from our discussions at the Langlade County Field Day, July 6. Importantly, a sincere thanks to Mr. Niles Franc for his organization and hosting of the Field Day. A sincere thanks also to Insight FS for their Support through the picnic, we had a great afternoon and appreciate the attendance.
At the Field Day, we reviewed the PVY risk calculator located on the
Vegetable Disease and Insect Forecasting Network site (VDIFN). We noted that the overall risk of PVY transmission by aphid vectors
begins around 1967 Fahrenheit Degree Days (FDD),
peaks around 2473 FDD, and
ends around 3228 FDD. PVY transmission risk is calculated from a combination of several aphid species, the relative abundance of each species in Wisconsin, and the estimated PVY transmission efficiency of each species. Aphid vectors include Soybean aphid, Bird cherry-oat aphid, Green peach aphid, Pea aphid, Corn leaf aphid, and Potato aphid.
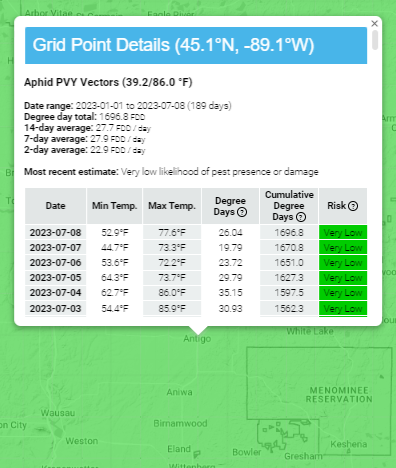
PVY risk details near Antigo, WI (retrieved July 8, 2023)
A screen shot from VDIFN (July 8, 2023) map focusing upon Antigo, WI specifically, illustrates the risk of aphid activity across a range of colors (high to low, red to green). Remember, to access this daily map, visit
VDIFN and select ‘Insect’ for Model Type, then ‘Aphid PVY Vectors’ in the Model Selection box, then click the blue ‘Submit’ button. Once at the correct map, you can zoom in on the image and click on any cell to obtain location specific estimates of accumulated FDD and the associated risk. Yesterday’s PVY risk map (July 8, 2023) illustrates that peak risk for transmission is rapidly entering southern Wisconsin and will progress across the state in very short order. The map suggests that we are currently at 1,697 FDD and are accumulating an estimated 28 FDD each day. Based upon these estimates, and when comparing this year’s weather progress with last year, we are ahead by an estimated 160 degree days (approx. 1 week). Last year, aphid risk was estimated to begin increasing in Antigo on July 24; this year that date may be closer to July 19 depending on the weather over the next two weeks.
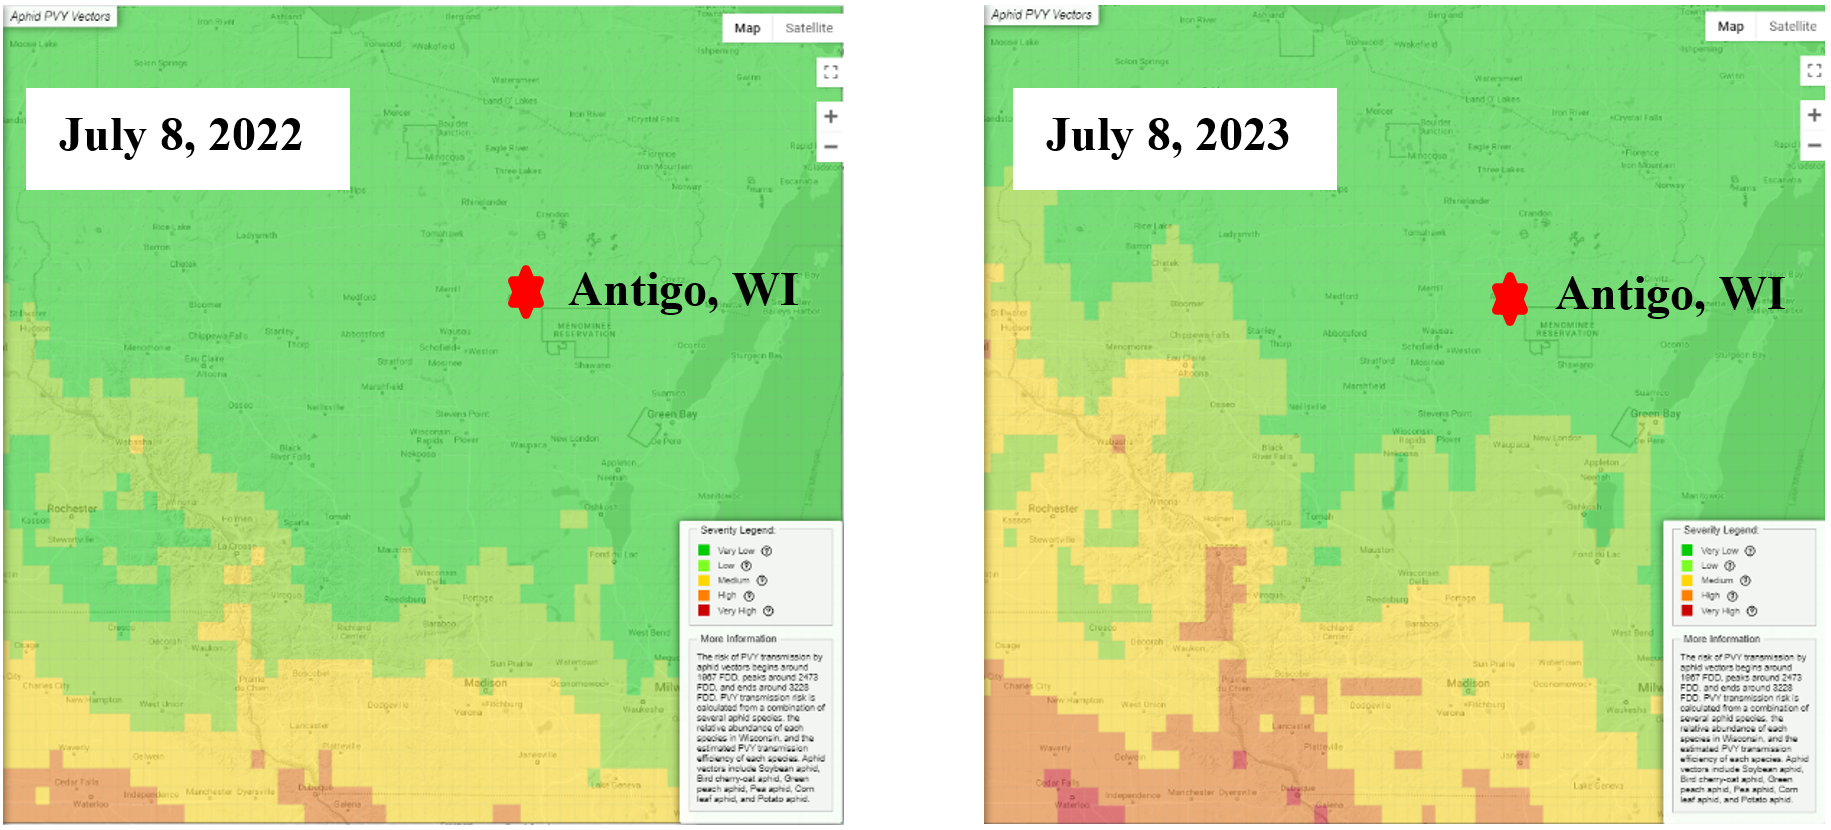
PVY risk model for Wisconsin comparing current year (2023) with last year’s risk on the same date. Note the additional risk progression this year vs last year, due to the hotter weather.
Part of our concern for the current season PVY risk stems from the weather conditions we have been experiencing in the 2023 season, and the number of aphids developing in different crops at this time of year. Recall that aphids are very small, soft-bodied insects that feed on plants with their piercing-sucking mouthparts (stylets). Aphids randomly land on plants in search of a suitable host. They will first “taste test” the plant by making several brief probes into cells near the surface of the leaf. If the plant (potato) is determined to be a suitable host, the aphid will remain on the plant and subsequently feed in the phloem and these aphids are called
colonizing species. Colonizing species in potato can include green peach aphid, potato aphid and infrequently the buckthorn aphid.
Non-colonizing winged aphids are those species that do not feed on potato but may taste test several plants as they move through the field, acquiring and inoculating PVY as they go. While colonizing aphids are generally more efficient vectors of PVY than non-colonizers, the sheer numbers of migrating, non-colorizing aphids pose a significant threat by introducing and moving PVY into and within a field. The standard use of systemic insecticides has minimized the populations of colonizing aphids so
most of the PVY spread occurring in the US potato crop is due to transient non-colonizing aphids. Soybean aphid and grain aphids (corn-leaf aphid, bird cherry-oat aphid, English grain aphid) are the prominent PVY vectors in the US given their behavior to fly in large numbers looking for pulse and grain crops.
Applications of paraffinic oils have previously been shown to modify the feeding behaviors of non-potato colonizing, migrating aphids alighting onto the potato canopy as they move through the local landscape. Specifically, these investigations have revealed that aphids are discouraged from probing on leaves that possess residues of compounds containing (> 95%) of paraffinic oils, resulting in limited inoculation attempts. A portion of our applied research program has investigated the value of these paraffinic oils in limiting non-persistent PVY transmission, by (1) determining the periods of greatest risk for aphid movement and transmission, coupled with (2) experiments to evaluate the timing and coverage of these different oil-containing compounds.
A few quick guidelines when attempting to manage this virus in seed:
- Don’t plant (or re-plant) a problem! Replant only the best foundation or certified seed potatoes. This is the absolute best defense any grower can have against PVY.
- Isolate seed fields from commercial production. Proximity to commercial potato increases your chances for disease spread considerably.
- Use border crops to surround high-valued seed lots. Border crops can “cleanse” PVY from aphid sytlets (mouthparts) before the aphids move into potatoes.
- Time planting and top kill to avoid peak aphid flights. Prevent late-season virus infection by planting and top-killing seed potato fields early.
- Spraying for potato-colonizing aphids can reduce spread of PVY within the field under circumstances where they have colonized and gained access. Spray only when scouting indicates green peach or potato aphid populations are above threshold levels.
- Plant immune or PVY resistant cultivars whenever possible and avoid planting tolerant cultivars in close proximity to fields with susceptible cultivars.
UW Potato Research Field Day – Hancock – July 13, 1-4:30 p.m. at Hancock Agricultural Research Station, N3909 County Road V, Hancock, WI. This field day features updates for the state’s potato industry on variety trials; disease, insect and weed management field experiments; and crop storage research. Following this year’s field day, a celebration will be held to honor the 75
th anniversary of the Wisconsin Potato and Vegetable Growers Association. The event will bring together WPVGA Hall of Fame members and past presidents, alongside UW–Madison emeritus professors, to recognize their collaborative research efforts to improve potato growing in Wisconsin’s Central Sands region. A free BBQ dinner and refreshments will be provided, sponsored by the WPVGA Associate Division. For more information, contact
hancock@cals.wisc.edu.
Read this newsletter as a PDF