There are many online tools available to growers to aid in decision-making when it comes to weather-based risks. Below are a few Wisconsin resources that we have developed or recommend:
Vegetable Pathology – Weather and Potato Disease Models – vegpath.plantpath.wisc.edu/weather-models/
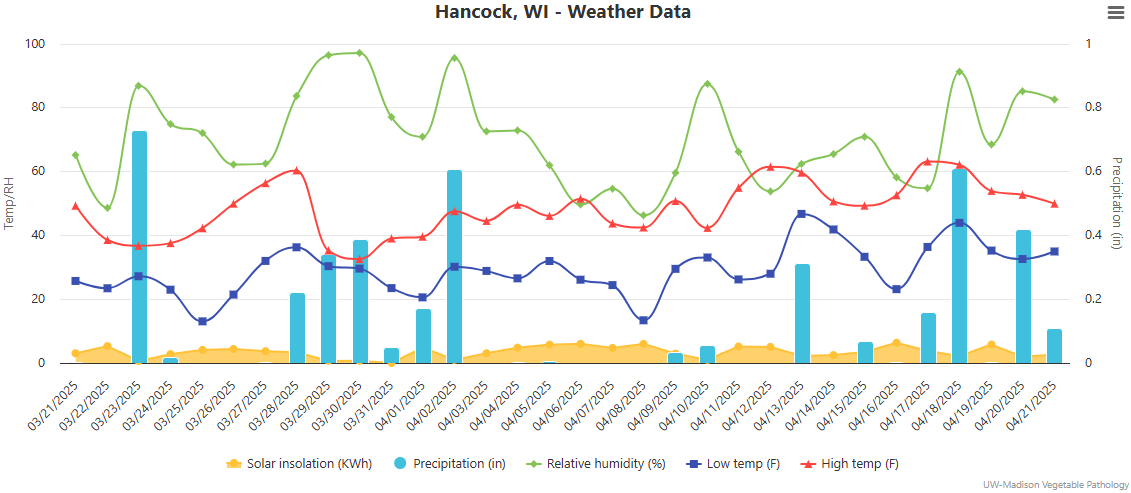
Convenient access to curated weather and disease risk charts here on this website. Pages are available for Spring Green, Arlington, Grand Marsh, Hancock, Plover, Antigo, and Rhinelander. Data is sourced from AgWeather. In addition, the website hosts more than a dozen fact sheets on common vegetable diseases including favorable conditions, life cycle, symptoms, management options, and links to risk models where available.
Wisconsin Environmental Mesonet – wisconet.wisc.edu
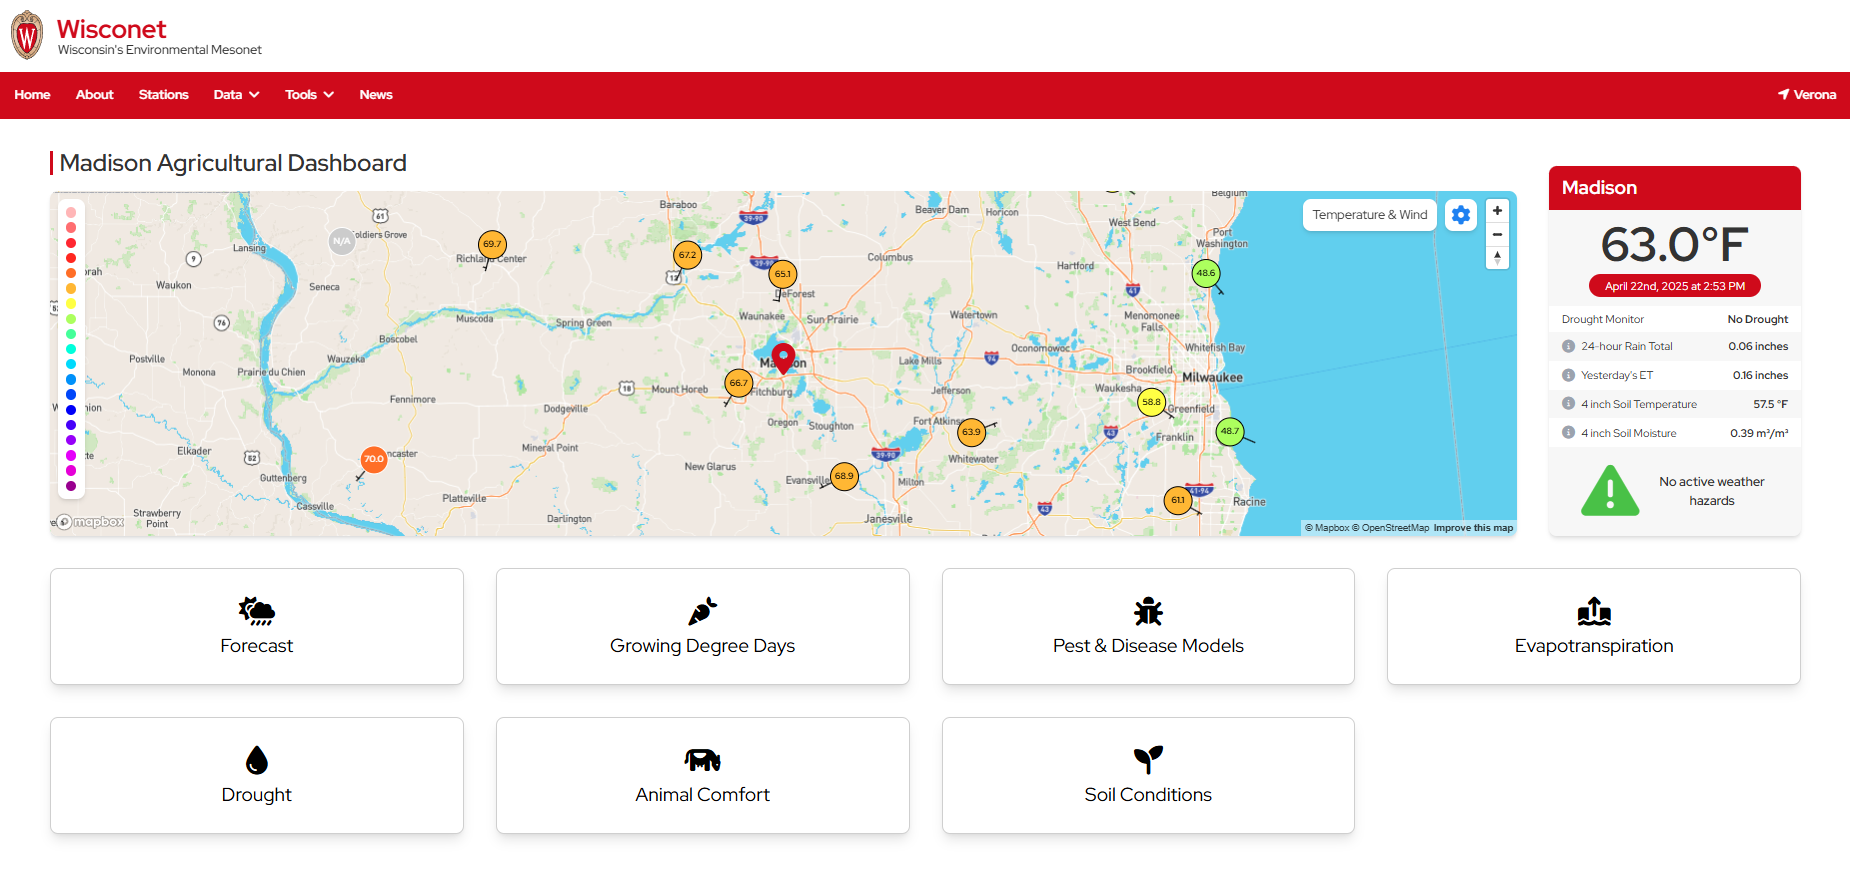
The Wisconsin Environmental Mesonet (WiscoNet) is a growing network of weather and soil monitoring stations across Wisconsin, designed to provide high quality data at high spatial and temporal resolutions. There are currently over 50 stations with plans to expand to around 90 by 2026. Each station provides more than one dozen measurements every 5 minutes. The web services associated with these stations were recently upgraded and provide many improvements over the prior version of the site. The screenshot shows an “Agricultural Dashboard” that can be created for any location in the state, showing a curated collection of important data feeds.
NEWA | Network for Environment and Weather Applications – https://newa.cornell.edu/
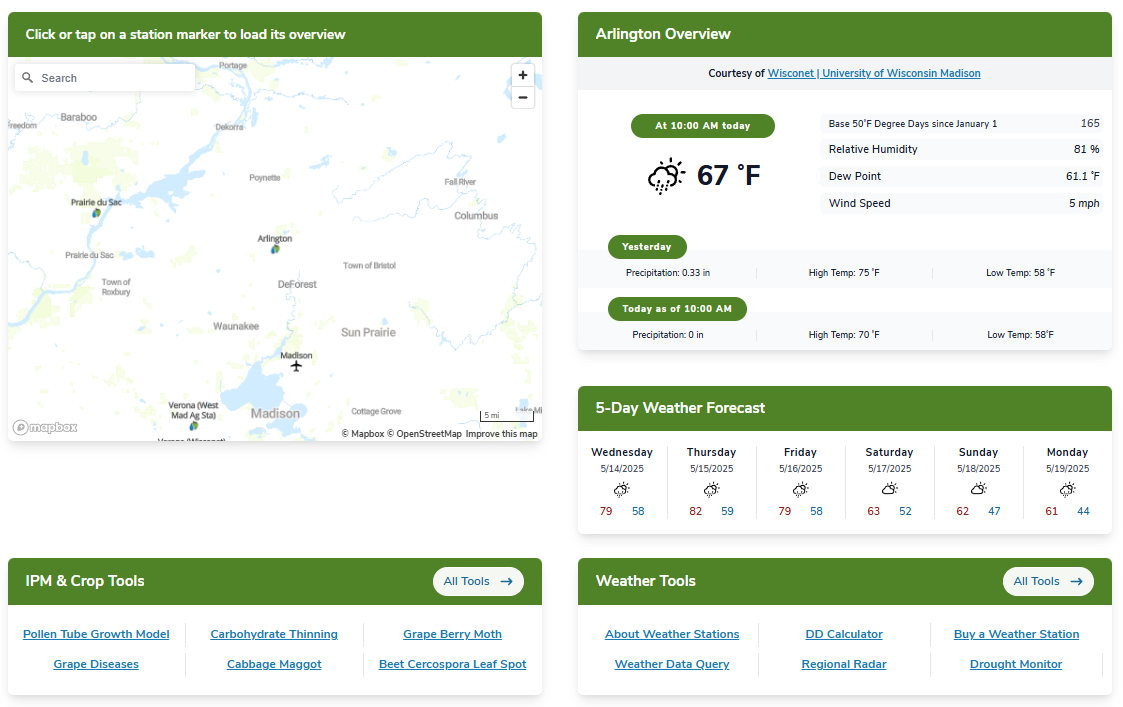
NEWA is an advanced platform that uses weather data from any of hundreds of weather stations across the United States, including all Wisconet stations, to run a number of models including crop development models, disease risk models, and insect development models. Users can create a profile to save their preferred models and other settings.
Crop Protection Network (CPN) Crop Risk Tool – connect.doit.wisc.edu/cpn-risk-tool/ (New for 2025)
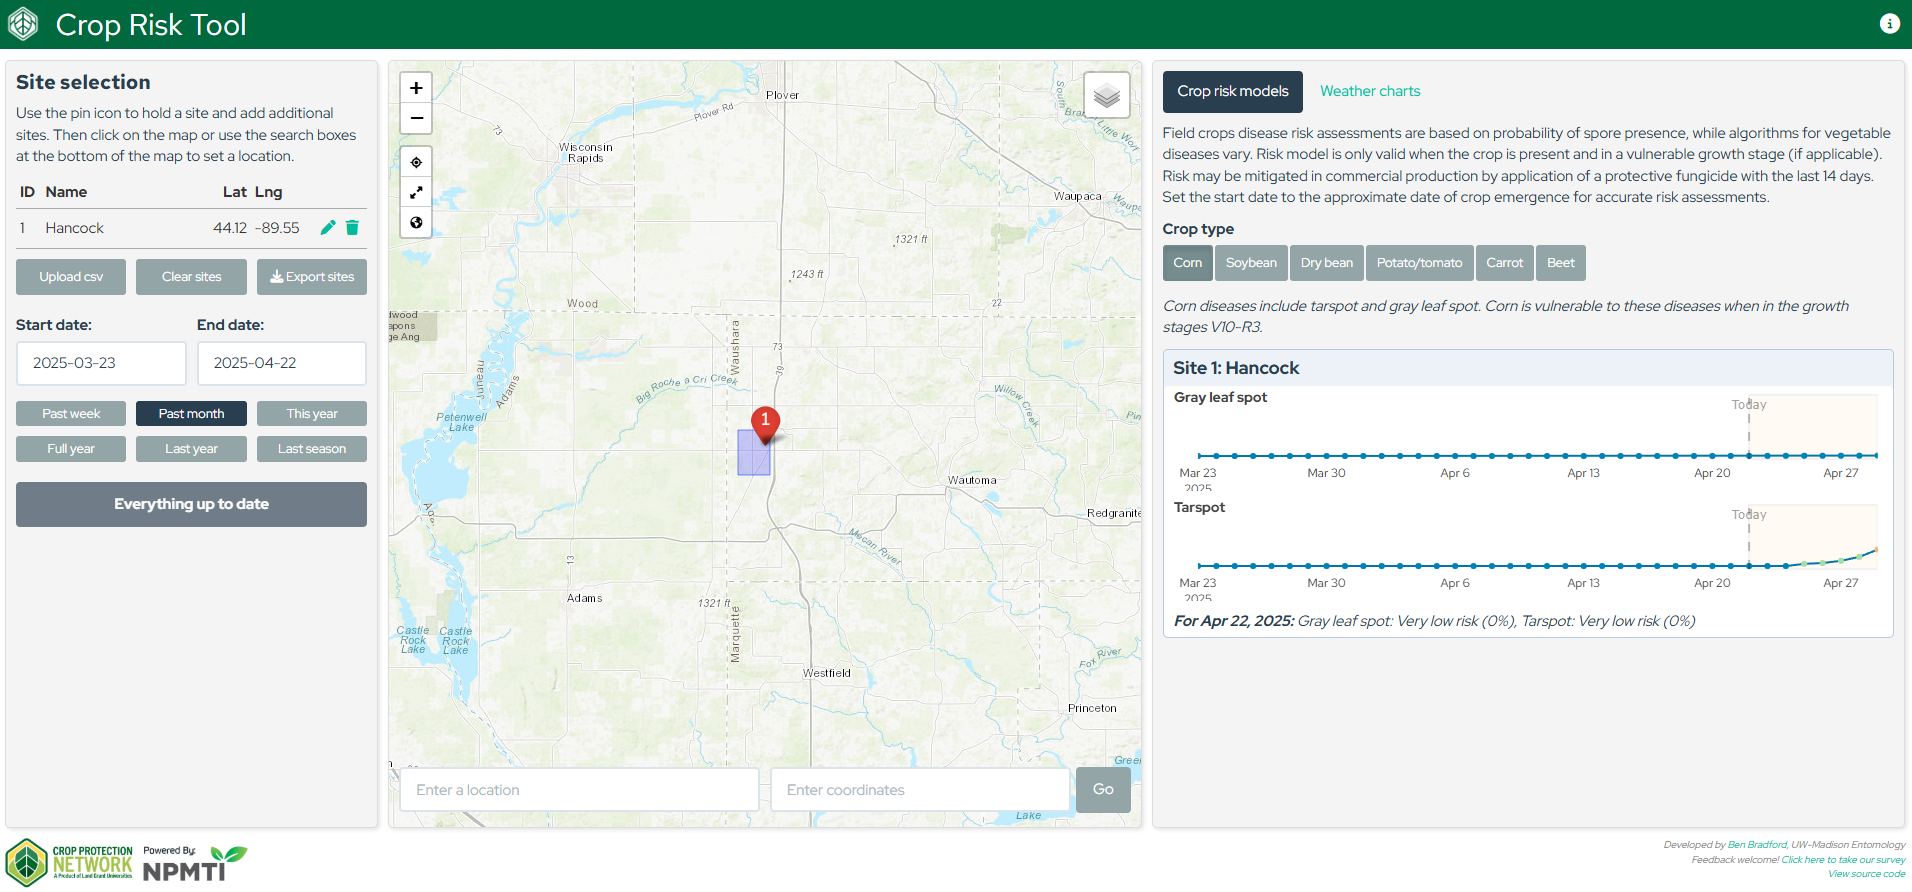
Use this tool to easily download hourly weather data for any point in the United States and Canada (below 60°N latitude) from 2015-present. Weather data is provided by a subscription to IBM’s Environmental Intelligence Suite API, and 7-day forecasts are sourced freely from NOAA (where available). Up to 10 locations may be pinned on the map and will be remembered in the browser when returning to the app. Crop risk models are currently available for corn (gray leaf spot, tarspot), bean (white mold, frogeye leaf spot), and vegetable crops (early blight, late blight, Alternaria, Cercospora, Botrytis).
Alfalfa Weather and Cutting Tool – connect.doit.wisc.edu/alfalfa-tool/
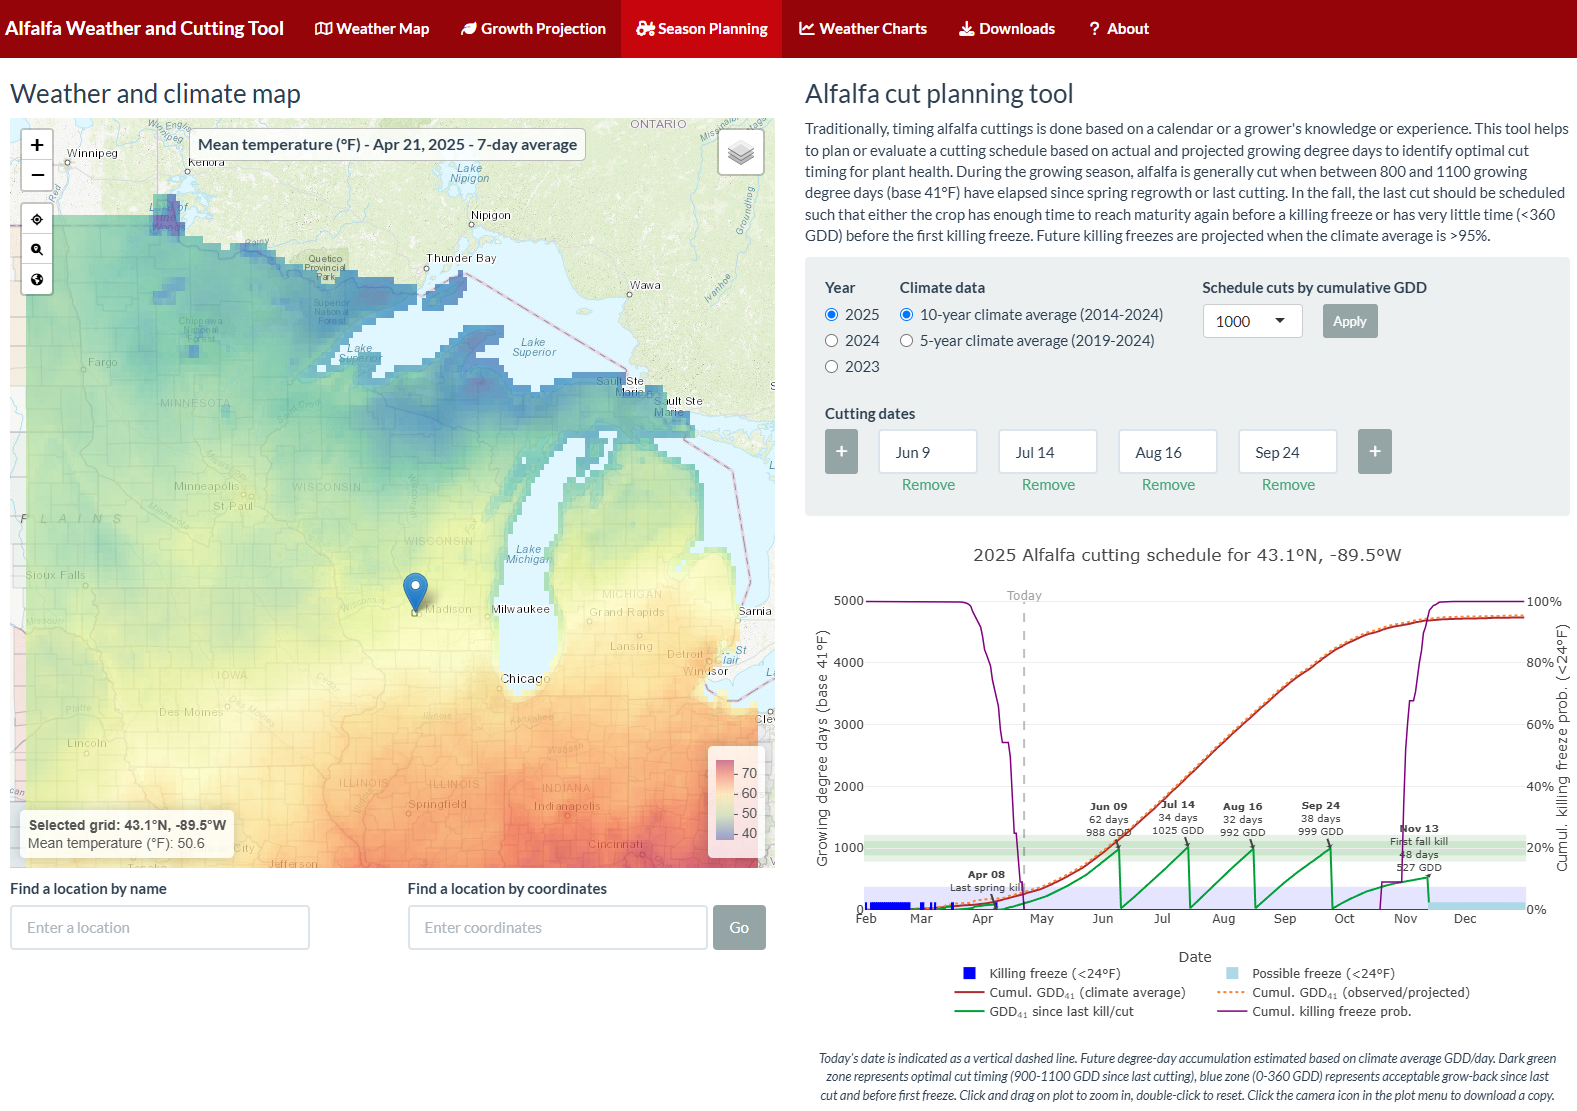
This tool was developed to help alfalfa growers in the upper Midwest plan and schedule their cuttings using location-specific weather-based recommendations, rather than calendar-based estimates. The tool also provides a map overlay with weather data, climate averages, and weather comparison to recent climate, in addition to location-specific weather and climate charts. Probabilities of last/first frost by date can also be explored based on 5- and 10-year climate averages.
Vegetable Disease and Insect Forecasting Network (VDIFN) – agweather.cals.wisc.edu/vdifn
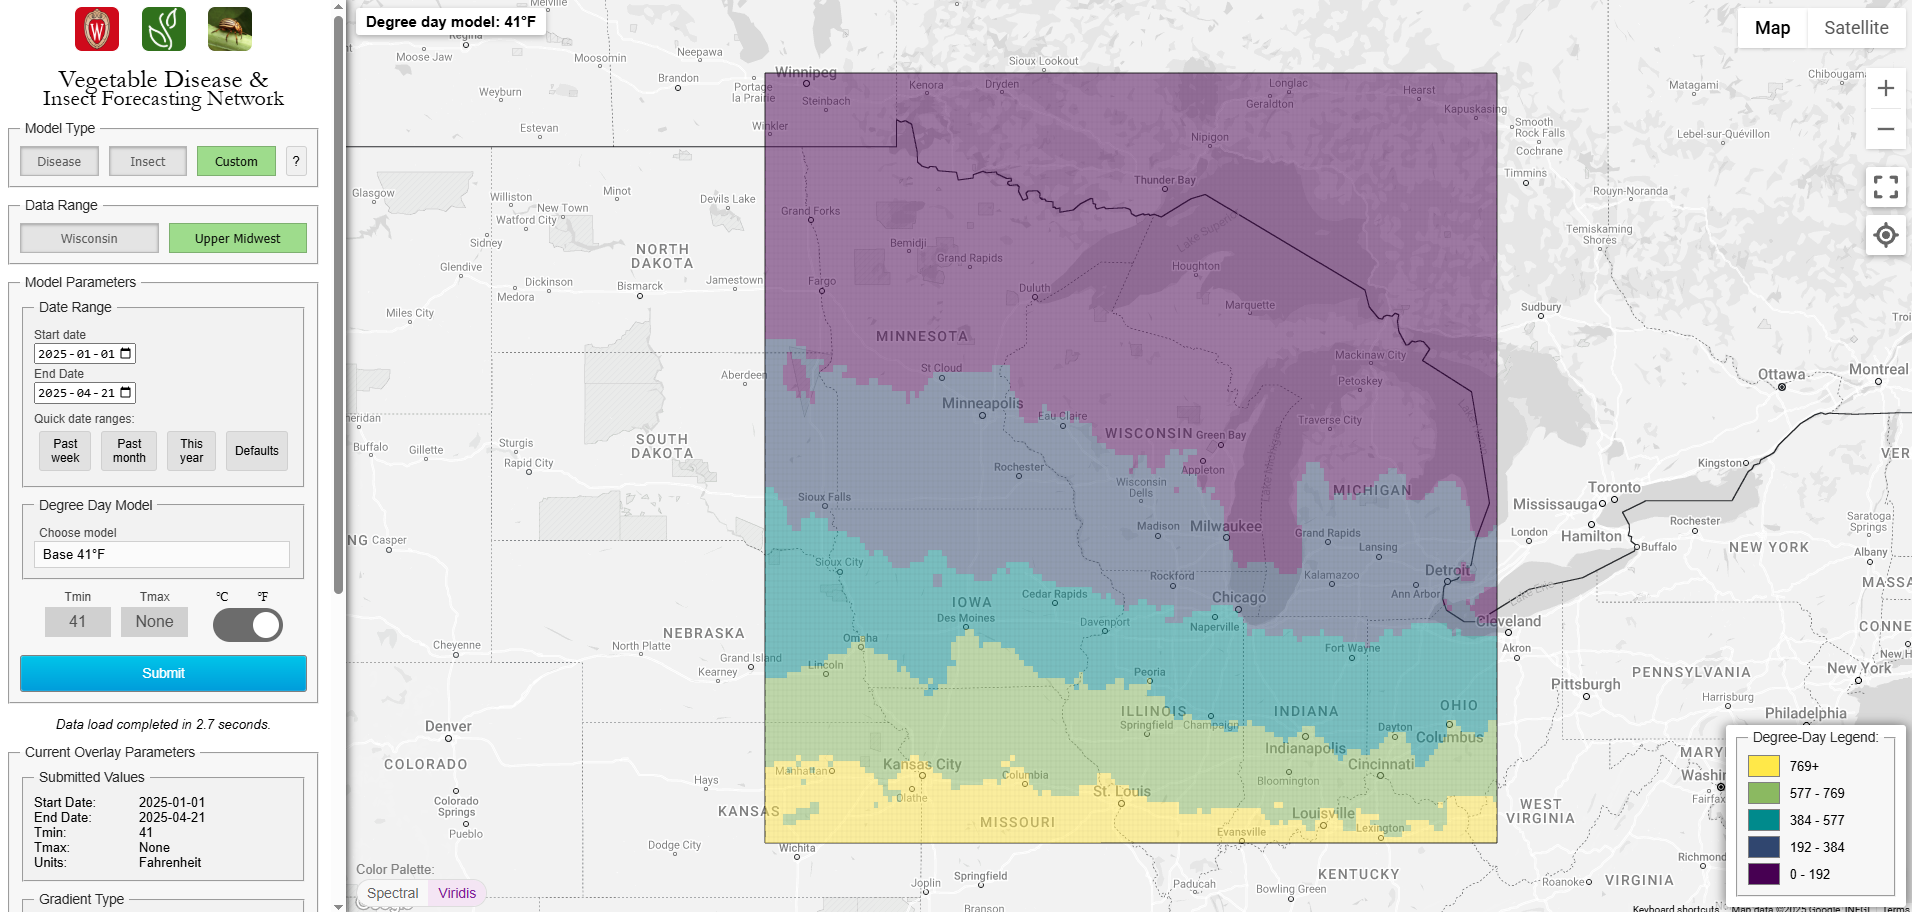
VDIFN uses daily gridded weather data which are fed into various disease risk and insect developmental models and converted into daily disease severity values (or equivalents) or degree-days. These disease severity value and degree-day accumulations are then displayed on the map as color-coded risk scores based on the estimated risk to susceptible crops. Clicking on an individual grid cell brings up the daily history of weather data and disease severity values or degree-days for that location. Recent updates: Added option to switch the color palette from Green-Red to Purple-Yellow for those who may be colorblind or prefer a different aesthetic.
Irrigation Scheduling Program – wisp.cals.wisc.edu
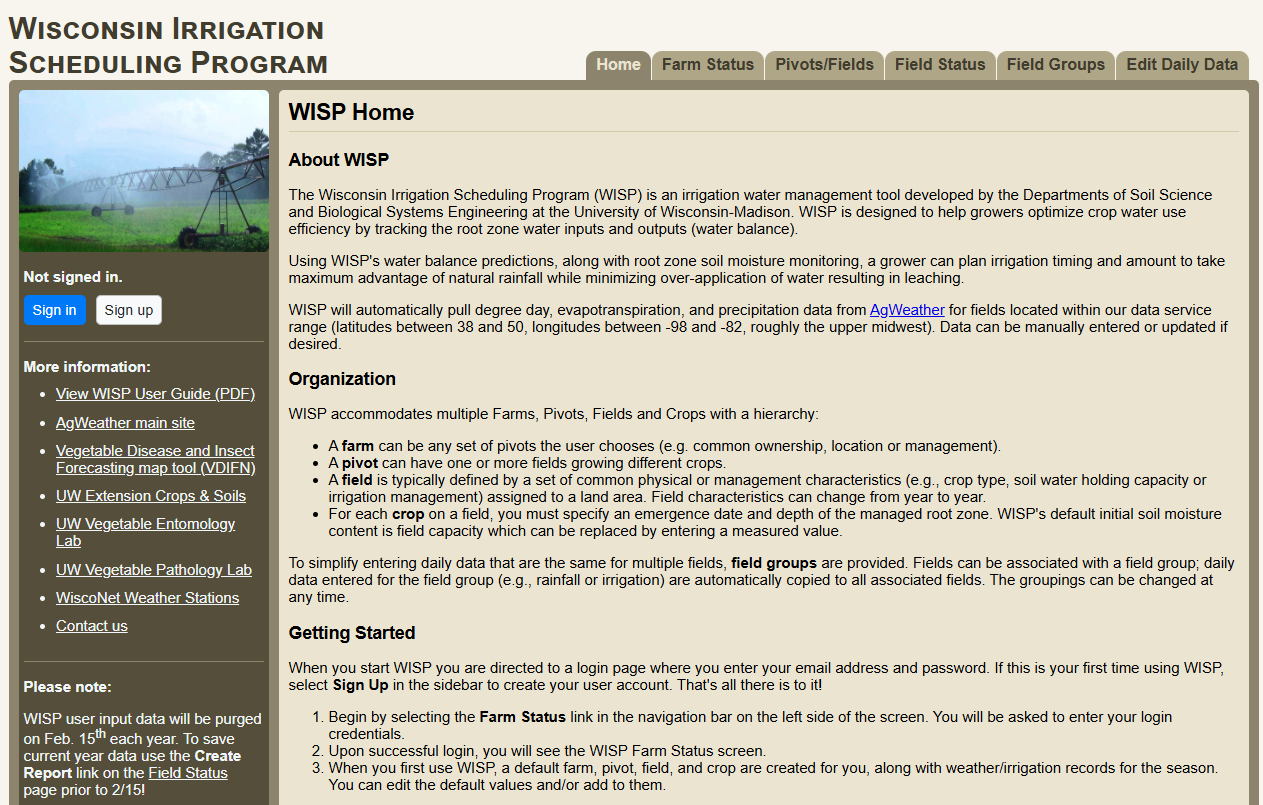
A complete irrigation scheduling program for your farm, it uses a few simple initial and periodically updated conditions (soil moisture, crop, canopy cover) as well as weather and potential evapotranspiration values (automatically imported but can be manually adjusted). Create a farm, add pivot(s), each pivot can serve one or more fields, and each field can have one crop. Once set up it tracks water balance in the field and predicts soil water levels. It warns when a field crosses below the allowable depletion or experiences deep drainage due to excess water.
UW Extension AgWeather – agweather.cals.wisc.edu
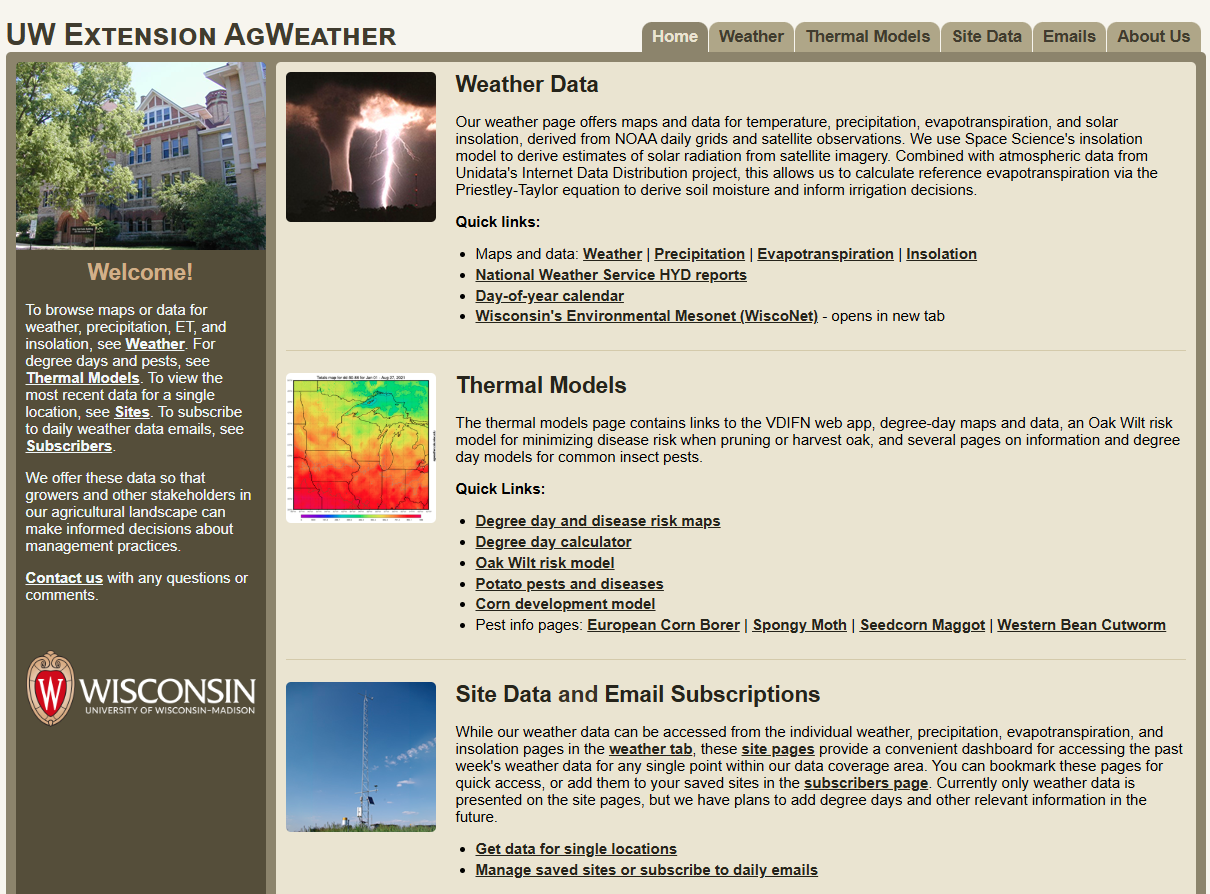
This site provides easy access to several different types of weather data from our database. Data coverage extends across the upper Midwest.
Features:
- Weather: Min/max daily air temp, precipitation, dew point, vapor pressure, hours of high humidity, and mean temperature during periods of high humidity.
- Solar insolation: A measure of the amount of solar radiation striking the surface of the earth, this data is sourced from the UW Space Science and Engineering Center and is used to compute potential evapotranspiration.
- Evapotranspiration: Useful in irrigation scheduling, these daily values are calculated from air temperature, solar insolation, latitude, and day of year.
- Thermal models: View/calculate degree day models and some disease risk models. Also available is an oak wilt risk model, essential if pruning oaks.
- Email subscriptions: Add sites of your choosing (home, field, etc.) and get optional daily weather updates, forecasts, and degree day models.
- Free API: Retrieve weather data via API for integration with custom software.
Iowa State Forecast and Assessment of Cropping sysTemS (FACTS) – https://facts.extension.iastate.edu/
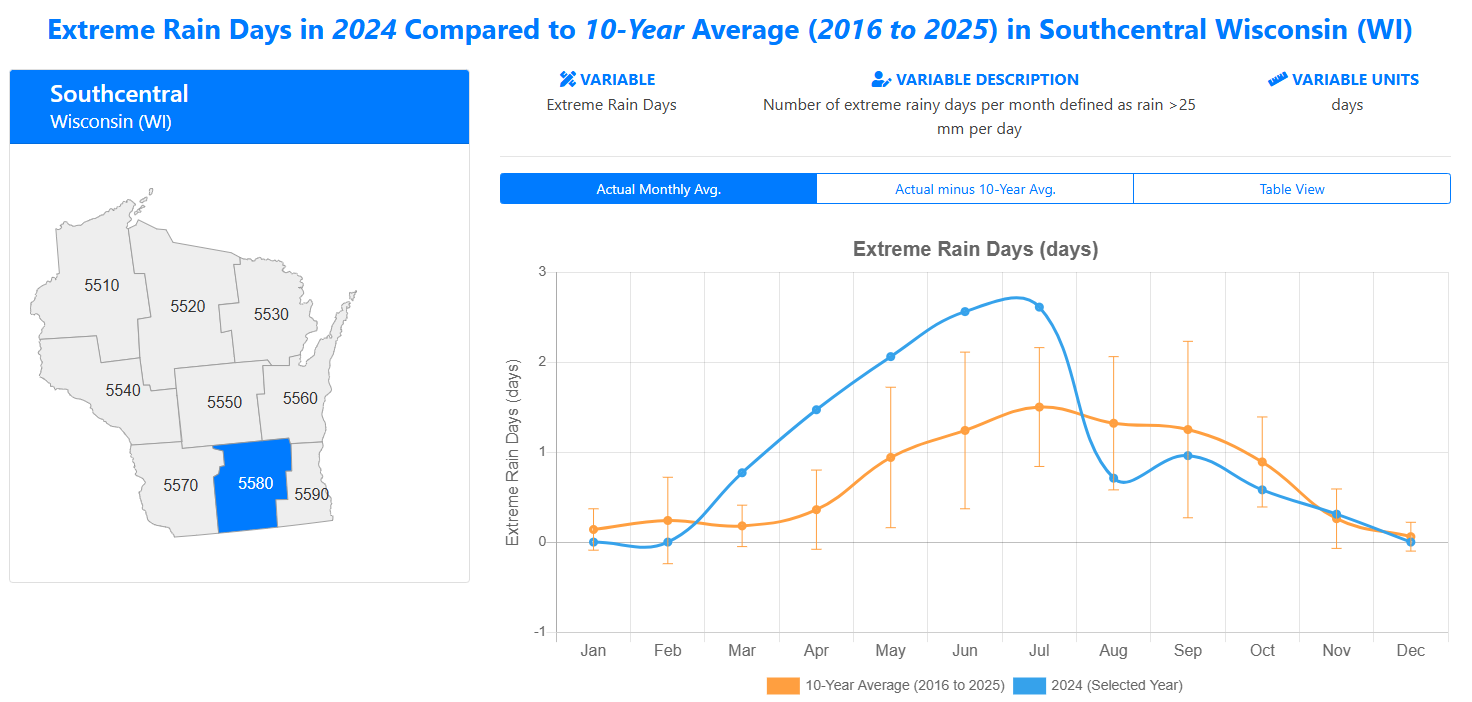
This site provides several decision support tools to benchmark weather and soil (water and nitrogen) conditions, determine corn harvest date, soybean planting date and maturity choices. The weather benchmark tool displays monthly weather summaries for temperature, precipitation, radiation and other weather indicators (e.g. number of days with extreme rain events or warm nights) at the crop reporting district level for 12 US Midwest states. It contains data from 1984 to today and is updated every month. The user can select a crop reporting district, a weather variable of interest, the month or year of interest and the tool displays benchmarking graphs and options to download the data or the images. The tool is best suited to answer questions like how does the July 2020 precipitation compare with the previous years? In addition, we have included USDA-NASS historical corn and soybean yields to facilitate easy comparisons between weather deviations and yield deviations.
University of Nebraska Lincoln High Plains Regional Climate Center Agroclimate Tools – https://hprcc.unl.edu/agroclimate/
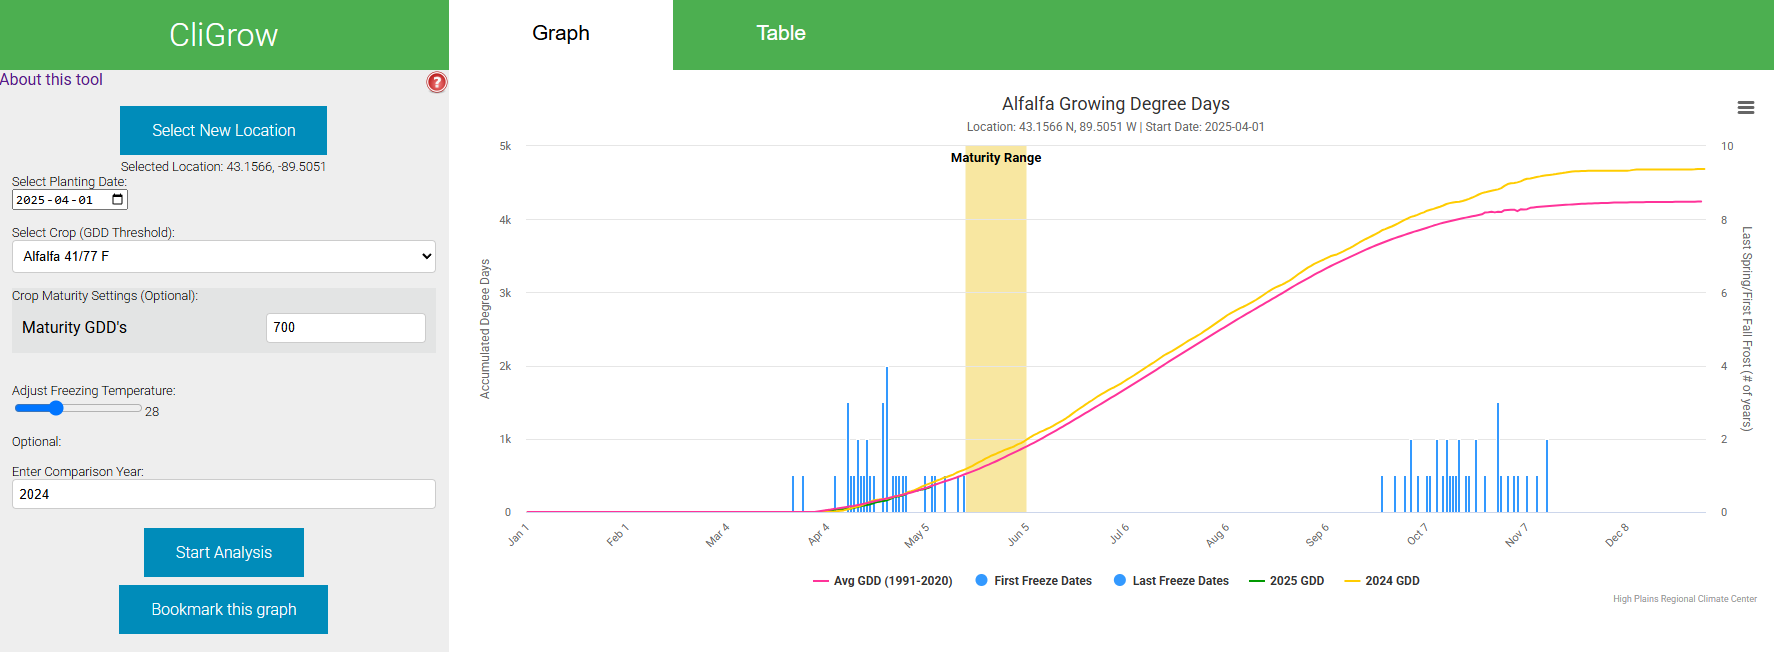
The High Plains Regional Climate Center provides several tools specifically for the agricultural community. CliGrow, shown above, contains several crop growth models and options to illustrate specific years against long-term climate averages, and shows historical last and first frost dates to help with planting and harvest decisions. Data is available for any location in the United States.